Palmarès des communes de Puy-de-Dômepar boulangeries par habitant
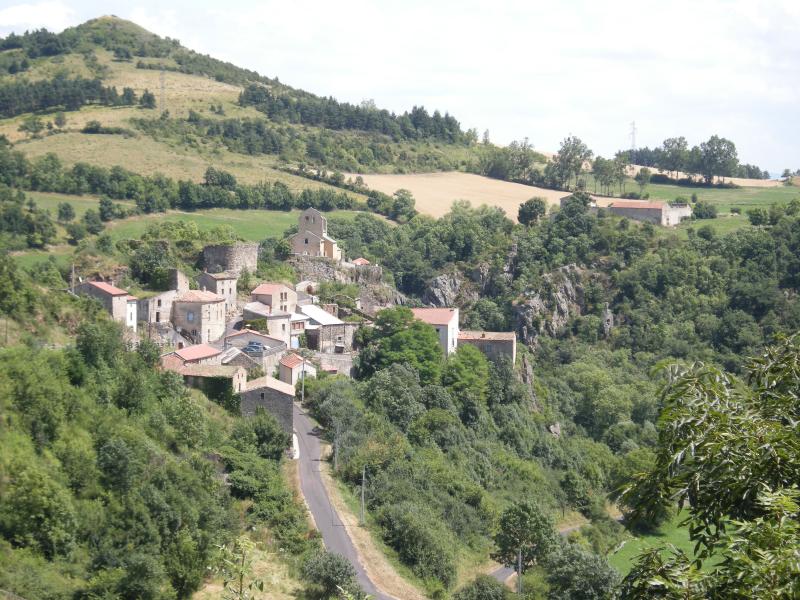
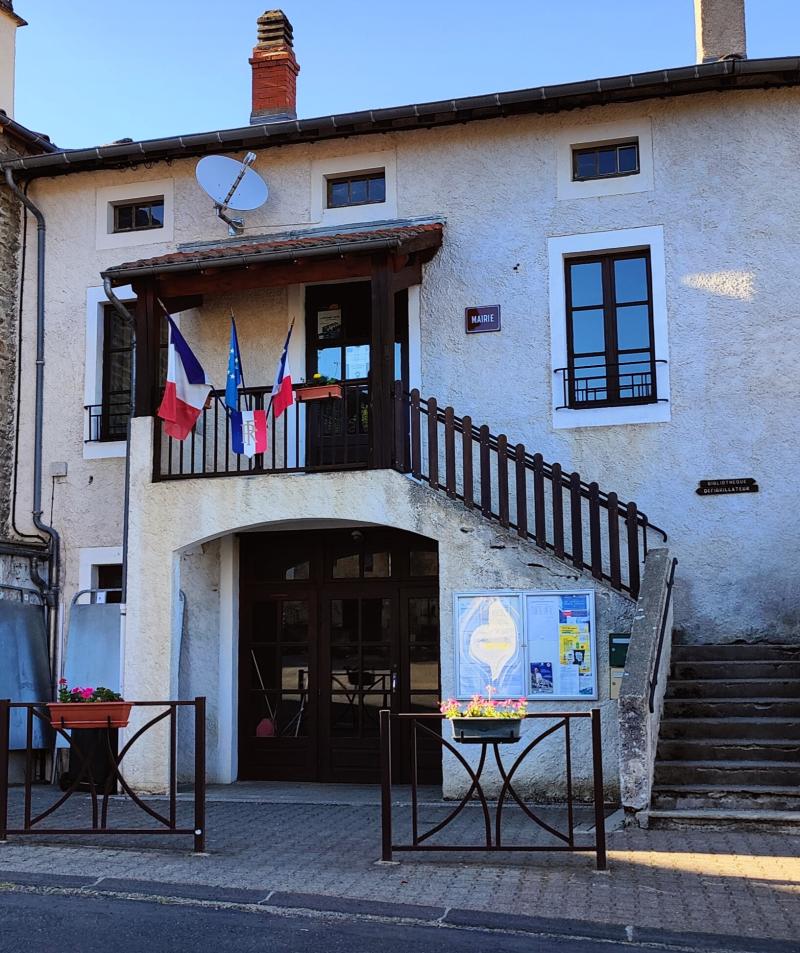
Saint-Hérent se distingue dans le Puy-de-Dôme avec 9,01 boulangeries pour 1 000 habitants, devant Valcivières (8,81) et Saint-Flour-L'étang (7,46). Ce classement des 175 communes repose sur la Base Permanente des Équipements (INSEE). Il identifie les localités où le pétrin tourne à plein régime et où les fournées rythment les matinées. Mie tiède, croûte dorée et baguette sous le bras : la densité de boulangeries reflète un art de vivre bien français. Un palmarès savoureux fondé sur des données open data.
1,75 boulangeries / 1 000 hab.
Moyenne départementale
1,22 boulangeries / 1 000 hab.
Médiane
9,01 boulangeries / 1 000 hab.
Max. — Saint-Hérent
0,24 boulangeries / 1 000 hab.
Min. — Pont-Du-Château
175 communes classées par boulangeries par habitant décroissante.
Critère de classement
Population
Superficie
Densité
Âge médian
Part des moins de 30 ans
Part des moins de 15 ans
Part des plus de 60 ans
Part des 75 ans et plus
Indice de vieillissement
Part de femmes
Part d'hommes
Croissance démographique
Taux de sédentarité
Taux de renouvellement
Revenu médian
Taux de chômage
Entreprises / 100 hab.
Diplômés du supérieur
Non-diplômés
Prix m² maisons
Prix m² appartements
Logements vacants
Résidences secondaires
Logements HLM
Taux de propriétaires
Logements anciens (av. 1919)
Suroccupation des logements
Taxe foncière
Passoires thermiques
Conso. énergétique moyenne
Couverture fibre
Score numérique
Artificialisation des sols
Part de forêts
Véhicules électriques
Part diesel
Véhicules par ménage
Médecins / hab.
Pharmacies / hab.
Écoles / hab.
Temps d'accès urgences
Boulangeries / hab.
Restaurants / hab.
Salons de coiffure / hab.
Dépenses / habitant
Dette / habitant
Épargne brute / hab.
Cambriolages
Escroqueries
Violences intrafamiliales
Vols de véhicules
Trafic de stupéfiants
Taux d'abstention
Votes blancs
Boulangeries / hab. (OSM)
Ronds-points / hab.
Bancs publics / hab.
Fontaines / hab.
Toilettes publiques / hab.
Aires de jeux / hab.
Monuments aux morts / hab.
Points d'eau potable / hab.
Lavoirs / hab.
Calvaires / km²
Chapelles / km²
Châteaux / km²
Ruines / km²
Lieux de culte / hab.
Églises / hab.
Département
Top 500 national
──────────
01 — Ain
02 — Aisne
03 — Allier
04 — Alpes-de-Haute-Provence
05 — Hautes-Alpes
06 — Alpes-Maritimes
07 — Ardèche
08 — Ardennes
09 — Ariège
10 — Aube
11 — Aude
12 — Aveyron
13 — Bouches-du-Rhône
14 — Calvados
15 — Cantal
16 — Charente
17 — Charente-Maritime
18 — Cher
19 — Corrèze
21 — Côte-d'Or
22 — Côtes-d'Armor
23 — Creuse
24 — Dordogne
25 — Doubs
26 — Drôme
27 — Eure
28 — Eure-et-Loir
29 — Finistère
2A — Corse-du-Sud
2B — Haute-Corse
30 — Gard
31 — Haute-Garonne
32 — Gers
33 — Gironde
34 — Hérault
35 — Ille-et-Vilaine
36 — Indre
37 — Indre-et-Loire
38 — Isère
39 — Jura
40 — Landes
41 — Loir-et-Cher
42 — Loire
43 — Haute-Loire
44 — Loire-Atlantique
45 — Loiret
46 — Lot
47 — Lot-et-Garonne
48 — Lozère
49 — Maine-et-Loire
50 — Manche
51 — Marne
52 — Haute-Marne
53 — Mayenne
54 — Meurthe-et-Moselle
55 — Meuse
56 — Morbihan
57 — Moselle
58 — Nièvre
59 — Nord
60 — Oise
61 — Orne
62 — Pas-de-Calais
63 — Puy-de-Dôme
64 — Pyrénées-Atlantiques
65 — Hautes-Pyrénées
66 — Pyrénées-Orientales
67 — Bas-Rhin
68 — Haut-Rhin
69 — Rhône
70 — Haute-Saône
71 — Saône-et-Loire
72 — Sarthe
73 — Savoie
74 — Haute-Savoie
75 — Paris
76 — Seine-Maritime
77 — Seine-et-Marne
78 — Yvelines
79 — Deux-Sèvres
80 — Somme
81 — Tarn
82 — Tarn-et-Garonne
83 — Var
84 — Vaucluse
85 — Vendée
86 — Vienne
87 — Haute-Vienne
88 — Vosges
89 — Yonne
90 — Territoire de Belfort
91 — Essonne
92 — Hauts-de-Seine
93 — Seine-Saint-Denis
94 — Val-de-Marne
95 — Val-d'Oise
971 — Guadeloupe
972 — Martinique
973 — Guyane
974 — La Réunion
976 — Mayotte
#1
9,01 boulangeries / 1 000 hab.
#2
8,81 boulangeries / 1 000 hab.
#3
7,46 boulangeries / 1 000 hab.
#4
6,93 boulangeries / 1 000 hab.
#5
6,71 boulangeries / 1 000 hab.
#6
6,39 boulangeries / 1 000 hab.
#7
5,62 boulangeries / 1 000 hab.
#8
4,39 boulangeries / 1 000 hab.
#9
4,30 boulangeries / 1 000 hab.
Classement complet
10
4,20 boulangeries / 1 000 hab.
11
4,20 boulangeries / 1 000 hab.
12
4,19 boulangeries / 1 000 hab.
13
4,17 boulangeries / 1 000 hab.
14
4,15 boulangeries / 1 000 hab.
15
3,98 boulangeries / 1 000 hab.
16
3,91 boulangeries / 1 000 hab.
17
3,65 boulangeries / 1 000 hab.
18
3,61 boulangeries / 1 000 hab.
19
3,58 boulangeries / 1 000 hab.
20
3,56 boulangeries / 1 000 hab.
21
3,47 boulangeries / 1 000 hab.
22
3,23 boulangeries / 1 000 hab.
23
3,21 boulangeries / 1 000 hab.
24
3,11 boulangeries / 1 000 hab.
25
3,09 boulangeries / 1 000 hab.
26
3,05 boulangeries / 1 000 hab.
27
2,98 boulangeries / 1 000 hab.
28
2,92 boulangeries / 1 000 hab.
29
2,85 boulangeries / 1 000 hab.
30
2,81 boulangeries / 1 000 hab.
31
2,79 boulangeries / 1 000 hab.
32
2,69 boulangeries / 1 000 hab.
33
2,54 boulangeries / 1 000 hab.
34
2,52 boulangeries / 1 000 hab.
35
2,50 boulangeries / 1 000 hab.
36
2,46 boulangeries / 1 000 hab.
37
2,46 boulangeries / 1 000 hab.
38
2,42 boulangeries / 1 000 hab.
39
2,42 boulangeries / 1 000 hab.
40
2,34 boulangeries / 1 000 hab.
41
2,33 boulangeries / 1 000 hab.
42
2,31 boulangeries / 1 000 hab.
43
2,29 boulangeries / 1 000 hab.
44
2,28 boulangeries / 1 000 hab.
45
2,26 boulangeries / 1 000 hab.
46
2,18 boulangeries / 1 000 hab.
47
2,13 boulangeries / 1 000 hab.
48
2,08 boulangeries / 1 000 hab.
49
1,97 boulangeries / 1 000 hab.
50
1,87 boulangeries / 1 000 hab.
51
1,85 boulangeries / 1 000 hab.
52
1,83 boulangeries / 1 000 hab.
53
1,83 boulangeries / 1 000 hab.
54
1,80 boulangeries / 1 000 hab.
55
1,73 boulangeries / 1 000 hab.
56
1,73 boulangeries / 1 000 hab.
57
1,72 boulangeries / 1 000 hab.
58
1,69 boulangeries / 1 000 hab.
59
1,65 boulangeries / 1 000 hab.
60
1,65 boulangeries / 1 000 hab.
61
1,64 boulangeries / 1 000 hab.
62
1,61 boulangeries / 1 000 hab.
63
1,61 boulangeries / 1 000 hab.
64
1,60 boulangeries / 1 000 hab.
65
1,58 boulangeries / 1 000 hab.
66
1,56 boulangeries / 1 000 hab.
67
1,49 boulangeries / 1 000 hab.
68
1,46 boulangeries / 1 000 hab.
69
1,45 boulangeries / 1 000 hab.
70
1,44 boulangeries / 1 000 hab.
71
1,44 boulangeries / 1 000 hab.
72
1,42 boulangeries / 1 000 hab.
73
1,40 boulangeries / 1 000 hab.
74
1,40 boulangeries / 1 000 hab.
75
1,39 boulangeries / 1 000 hab.
76
1,39 boulangeries / 1 000 hab.
77
1,36 boulangeries / 1 000 hab.
78
1,36 boulangeries / 1 000 hab.
79
1,36 boulangeries / 1 000 hab.
80
1,35 boulangeries / 1 000 hab.
81
1,35 boulangeries / 1 000 hab.
82
1,34 boulangeries / 1 000 hab.
83
1,33 boulangeries / 1 000 hab.
84
1,29 boulangeries / 1 000 hab.
85
1,27 boulangeries / 1 000 hab.
86
1,26 boulangeries / 1 000 hab.
87
1,24 boulangeries / 1 000 hab.
88
1,22 boulangeries / 1 000 hab.
89
1,21 boulangeries / 1 000 hab.
90
1,21 boulangeries / 1 000 hab.
91
1,19 boulangeries / 1 000 hab.
92
1,18 boulangeries / 1 000 hab.
93
1,17 boulangeries / 1 000 hab.
94
1,17 boulangeries / 1 000 hab.
95
1,17 boulangeries / 1 000 hab.
96
1,16 boulangeries / 1 000 hab.
97
1,15 boulangeries / 1 000 hab.
98
1,14 boulangeries / 1 000 hab.
99
1,14 boulangeries / 1 000 hab.
100
1,14 boulangeries / 1 000 hab.
101
1,13 boulangeries / 1 000 hab.
102
1,12 boulangeries / 1 000 hab.
103
1,12 boulangeries / 1 000 hab.
104
1,11 boulangeries / 1 000 hab.
105
1,10 boulangeries / 1 000 hab.
106
1,09 boulangeries / 1 000 hab.
107
1,08 boulangeries / 1 000 hab.
108
1,08 boulangeries / 1 000 hab.
109
1,05 boulangeries / 1 000 hab.
110
1,05 boulangeries / 1 000 hab.
111
1,05 boulangeries / 1 000 hab.
112
1,03 boulangeries / 1 000 hab.
113
1,03 boulangeries / 1 000 hab.
114
1,02 boulangeries / 1 000 hab.
115
1,00 boulangeries / 1 000 hab.
116
0,98 boulangeries / 1 000 hab.
117
0,97 boulangeries / 1 000 hab.
118
0,97 boulangeries / 1 000 hab.
119
0,96 boulangeries / 1 000 hab.
120
0,96 boulangeries / 1 000 hab.
121
0,95 boulangeries / 1 000 hab.
122
0,92 boulangeries / 1 000 hab.
123
0,89 boulangeries / 1 000 hab.
124
0,88 boulangeries / 1 000 hab.
125
0,87 boulangeries / 1 000 hab.
126
0,86 boulangeries / 1 000 hab.
127
0,85 boulangeries / 1 000 hab.
128
0,85 boulangeries / 1 000 hab.
129
0,82 boulangeries / 1 000 hab.
130
0,77 boulangeries / 1 000 hab.
131
0,76 boulangeries / 1 000 hab.
132
0,74 boulangeries / 1 000 hab.
133
0,73 boulangeries / 1 000 hab.
134
0,73 boulangeries / 1 000 hab.
135
0,73 boulangeries / 1 000 hab.
136
0,72 boulangeries / 1 000 hab.
137
0,70 boulangeries / 1 000 hab.
138
0,70 boulangeries / 1 000 hab.
139
0,69 boulangeries / 1 000 hab.
140
0,69 boulangeries / 1 000 hab.
141
0,66 boulangeries / 1 000 hab.
142
0,64 boulangeries / 1 000 hab.
143
0,63 boulangeries / 1 000 hab.
144
0,63 boulangeries / 1 000 hab.
145
0,63 boulangeries / 1 000 hab.
146
0,62 boulangeries / 1 000 hab.
147
0,62 boulangeries / 1 000 hab.
148
0,61 boulangeries / 1 000 hab.
149
0,60 boulangeries / 1 000 hab.
150
0,59 boulangeries / 1 000 hab.
151
0,57 boulangeries / 1 000 hab.
152
0,56 boulangeries / 1 000 hab.
153
0,55 boulangeries / 1 000 hab.
154
0,55 boulangeries / 1 000 hab.
155
0,54 boulangeries / 1 000 hab.
156
0,54 boulangeries / 1 000 hab.
157
0,52 boulangeries / 1 000 hab.
158
0,52 boulangeries / 1 000 hab.
159
0,51 boulangeries / 1 000 hab.
160
0,49 boulangeries / 1 000 hab.
161
0,48 boulangeries / 1 000 hab.
162
0,48 boulangeries / 1 000 hab.
163
0,45 boulangeries / 1 000 hab.
164
0,45 boulangeries / 1 000 hab.
165
0,45 boulangeries / 1 000 hab.
166
0,45 boulangeries / 1 000 hab.
167
0,42 boulangeries / 1 000 hab.
168
0,41 boulangeries / 1 000 hab.
169
0,40 boulangeries / 1 000 hab.
170
0,37 boulangeries / 1 000 hab.
171
0,35 boulangeries / 1 000 hab.
172
0,28 boulangeries / 1 000 hab.
173
0,26 boulangeries / 1 000 hab.
174
0,25 boulangeries / 1 000 hab.
175
0,24 boulangeries / 1 000 hab.
Source :
OpenStreetMap
— Contributeurs OSM — ODbL
FAQ — boulangeries par habitant Puy-de-Dôme
Quelle commune a le meilleur classement par boulangeries par habitant de Puy-de-Dôme ?
Saint-Hérent arrive en tête du classement par boulangeries par habitant de Puy-de-Dôme avec 9,01 boulangeries / 1 000 hab..
Quelles sont les 3 premières communes par boulangeries par habitant de Puy-de-Dôme ?
Le podium par boulangeries par habitant de Puy-de-Dôme : 1) Saint-Hérent, 2) Valcivières, 3) Saint-Flour-L'étang.
Quelle commune est dernière par boulangeries par habitant de Puy-de-Dôme ?
Pont-Du-Château est classée dernière (175e) avec 0,24 boulangeries / 1 000 hab..
Combien de communes dans ce classement par boulangeries par habitant ?
Ce classement comprend 175 communes de Puy-de-Dôme.
Existe-t-il un classement national par boulangeries par habitant ?
Oui, consultez le Top 500 national par boulangeries par habitant pour comparer les communes de toute la France.
Quelles sont les sources de données de ce classement ?
Les données proviennent des sources officielles : INSEE, DGFIP, IGN, Base Permanente des Équipements et data.gouv.fr.
Quelle est la moyenne de Puy-de-Dôme par boulangeries par habitant ?
La moyenne de Puy-de-Dôme est de 1,75 boulangeries / 1 000 hab.. La médiane se situe à 1,22 boulangeries / 1 000 hab..
Combien de communes de Puy-de-Dôme dépassent la moyenne par boulangeries par habitant ?
54 communes sur 175 ont une valeur supérieure à la moyenne départementale (1,75 boulangeries / 1 000 hab.).
Quel est l'écart entre la première et la dernière commune par boulangeries par habitant de Puy-de-Dôme ?
Saint-Hérent affiche 9,01 boulangeries / 1 000 hab. contre 0,24 boulangeries / 1 000 hab. pour Pont-Du-Château, soit un écart significatif révélateur des disparités territoriales.