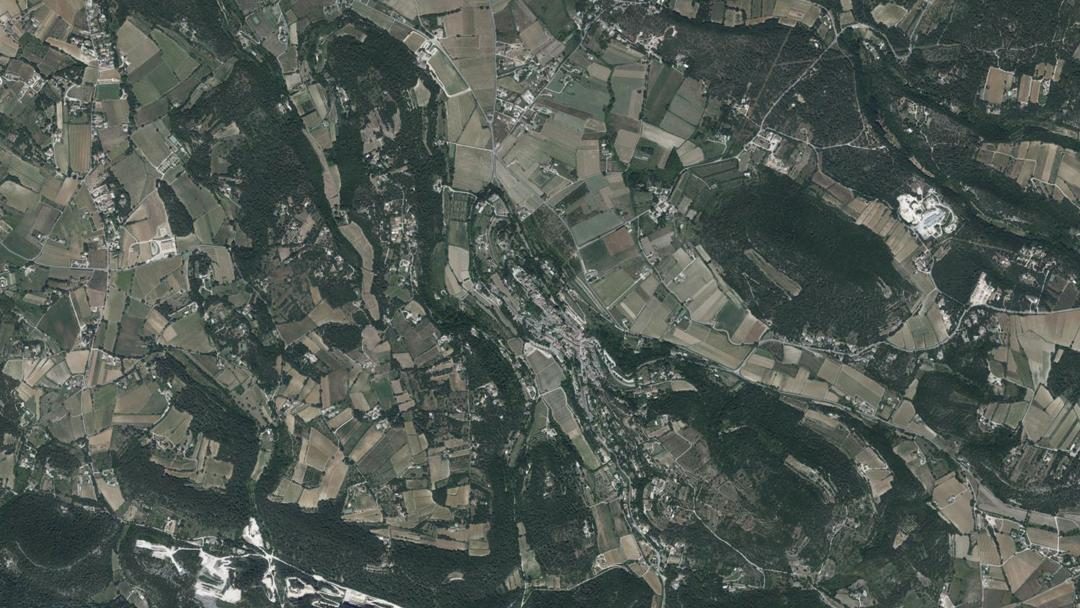
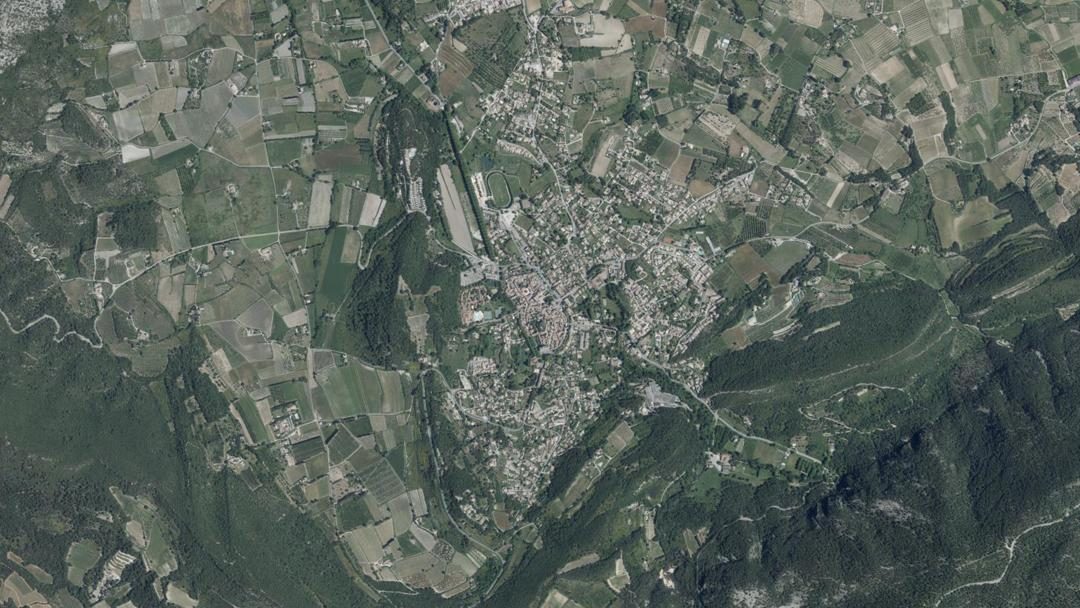
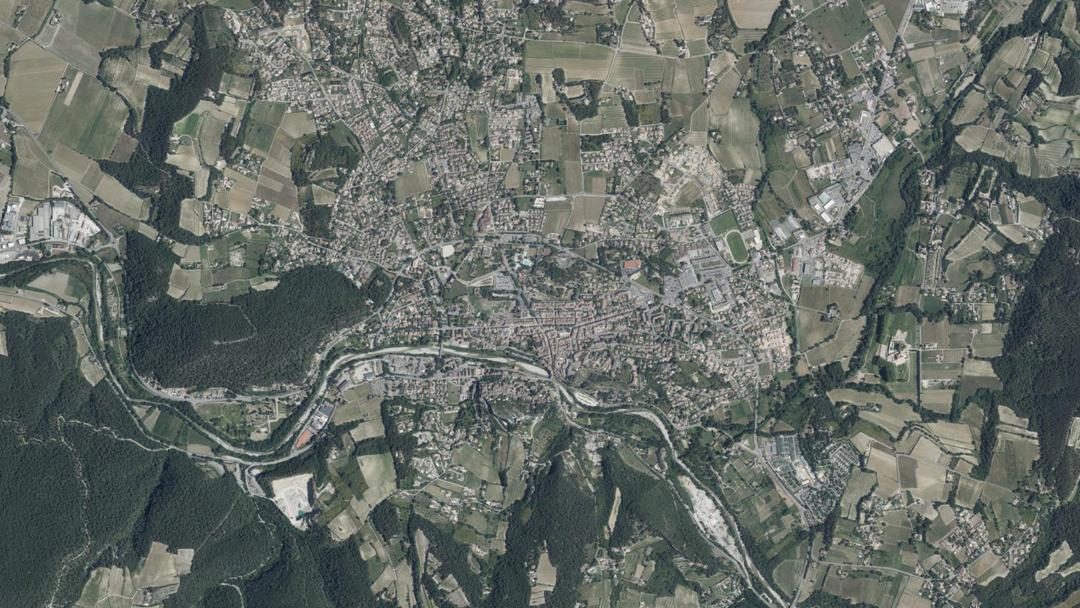
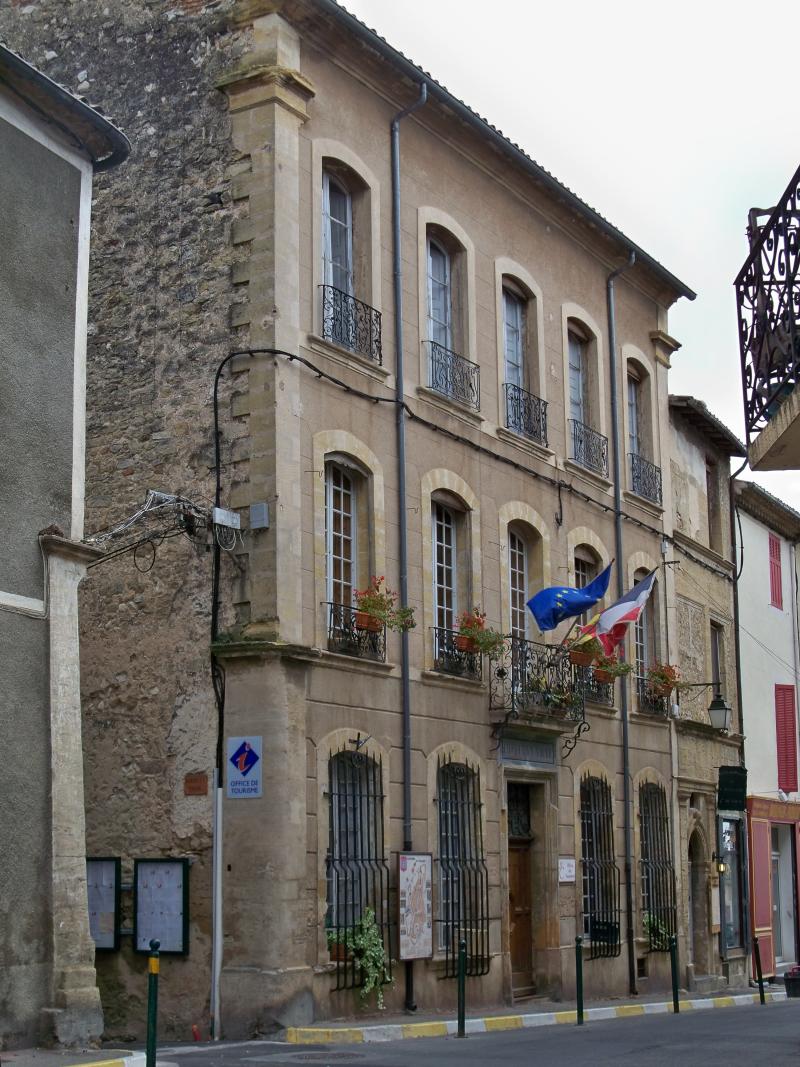
Palmarès des communes de Vaucluse
par boulangeries par habitant

Dans le Vaucluse, Savoillan affiche 12,35 boulangeries pour 1 000 habitants, devant Puyméras (5,13) et Crestet (4,82). Ce classement, issu de la Base Permanente des Équipements de l'INSEE (BPE), mesure la présence de ce commerce essentiel parmi les 99 communes. Il révèle les territoires où la mie chaude, les fournées matinales et l'odeur du pétrin font partie du quotidien. De la baguette tradition à la croûte dorée, ce palmarès gourmand dessine la carte de l'artisanat boulanger. Données open data officielles.

1,18 boulangeries / 1 000 hab.
Moyenne départementale
0,92 boulangeries / 1 000 hab.
Médiane
5,13 boulangeries / 1 000 hab.
Max. — Puyméras
0,22 boulangeries / 1 000 hab.
Min. — Entraigues-sur-La-Sorgue
92 communes classées par boulangeries par habitant décroissante.
Filtrer par taille de commune
#1 Puyméras

Puyméras

84110
Population 585 hab. Boulangeries par habitant 5,13 boulangeries / 1 000 hab.
#2 Ménerbes

Ménerbes

84560
Population 962 hab. Boulangeries par habitant 4,16 boulangeries / 1 000 hab.
#3 Fontaine-De-Vaucluse
Population 585 hab. Boulangeries par habitant 3,42 boulangeries / 1 000 hab.
#4 Grambois

Grambois

84240
Population 1 234 hab. Boulangeries par habitant 3,24 boulangeries / 1 000 hab.
#5 Bonnieux

Bonnieux

84480
Population 1 198 hab. Boulangeries par habitant 2,50 boulangeries / 1 000 hab.
#6 Malaucène

Malaucène

84340
Population 2 758 hab. Boulangeries par habitant 2,18 boulangeries / 1 000 hab.
#7 Vaison-La-Romaine
Population 6 058 hab. Boulangeries par habitant 2,15 boulangeries / 1 000 hab.
#8 Cucuron

Cucuron

84160
Population 1 885 hab. Boulangeries par habitant 2,12 boulangeries / 1 000 hab.
#9 Maubec

Maubec

84660
Population 1 915 hab. Boulangeries par habitant 2,09 boulangeries / 1 000 hab.

Classement complet

10
1,96 boulangeries / 1 000 hab.
11
Ansouis 84240
1,88 boulangeries / 1 000 hab.
12
1,81 boulangeries / 1 000 hab.
13
1,78 boulangeries / 1 000 hab.
14
Violès 84150
1,70 boulangeries / 1 000 hab.
15
Visan 84820
1,62 boulangeries / 1 000 hab.
16
1,60 boulangeries / 1 000 hab.
17
Roaix 84110
1,60 boulangeries / 1 000 hab.
18
Viens 84750
1,60 boulangeries / 1 000 hab.
19
1,59 boulangeries / 1 000 hab.
20
1,54 boulangeries / 1 000 hab.
21
1,52 boulangeries / 1 000 hab.
22
Sault 84390
1,49 boulangeries / 1 000 hab.
23
Apt 84400
1,48 boulangeries / 1 000 hab.
24
1,45 boulangeries / 1 000 hab.
25
Sablet 84110
1,39 boulangeries / 1 000 hab.
26
1,38 boulangeries / 1 000 hab.
27
Cadenet 84160
1,38 boulangeries / 1 000 hab.
28
1,33 boulangeries / 1 000 hab.
29
Villars 84400
1,28 boulangeries / 1 000 hab.
30
Rasteau 84110
1,23 boulangeries / 1 000 hab.
31
1,23 boulangeries / 1 000 hab.
32
Gordes 84220
1,20 boulangeries / 1 000 hab.
33
1,18 boulangeries / 1 000 hab.
34
Puyvert 84160
1,16 boulangeries / 1 000 hab.
35
1,15 boulangeries / 1 000 hab.
36
1,14 boulangeries / 1 000 hab.
37
1,14 boulangeries / 1 000 hab.
38
Lauris 84360
1,02 boulangeries / 1 000 hab.
39
Gargas 84400
0,99 boulangeries / 1 000 hab.
40
0,98 boulangeries / 1 000 hab.
41
Bédoin 84410
0,97 boulangeries / 1 000 hab.
42
Avignon 84000
0,97 boulangeries / 1 000 hab.
43
Goult 84220
0,95 boulangeries / 1 000 hab.
44
0,95 boulangeries / 1 000 hab.
45
0,94 boulangeries / 1 000 hab.
46
0,92 boulangeries / 1 000 hab.
47
0,92 boulangeries / 1 000 hab.
48
Pertuis 84120
0,92 boulangeries / 1 000 hab.
49
0,91 boulangeries / 1 000 hab.
50
0,89 boulangeries / 1 000 hab.
51
0,88 boulangeries / 1 000 hab.
52
0,88 boulangeries / 1 000 hab.
53
Piolenc 84420
0,87 boulangeries / 1 000 hab.
54
0,86 boulangeries / 1 000 hab.
55
Caromb 84330
0,86 boulangeries / 1 000 hab.
56
0,85 boulangeries / 1 000 hab.
57
0,85 boulangeries / 1 000 hab.
58
Robion 84440
0,83 boulangeries / 1 000 hab.
59
Orange 84100
0,81 boulangeries / 1 000 hab.
60
0,78 boulangeries / 1 000 hab.
61
Lapalud 84840
0,78 boulangeries / 1 000 hab.
62
Mornas 84550
0,78 boulangeries / 1 000 hab.
63
Oppède 84580
0,78 boulangeries / 1 000 hab.
64
0,78 boulangeries / 1 000 hab.
65
0,77 boulangeries / 1 000 hab.
66
0,77 boulangeries / 1 000 hab.
67
0,76 boulangeries / 1 000 hab.
68
0,75 boulangeries / 1 000 hab.
69
Vedène 84270
0,75 boulangeries / 1 000 hab.
70
0,75 boulangeries / 1 000 hab.
71
0,73 boulangeries / 1 000 hab.
72
0,71 boulangeries / 1 000 hab.
73
0,71 boulangeries / 1 000 hab.
74
0,70 boulangeries / 1 000 hab.
75
0,69 boulangeries / 1 000 hab.
76
0,68 boulangeries / 1 000 hab.
77
0,68 boulangeries / 1 000 hab.
78
0,67 boulangeries / 1 000 hab.
79
0,67 boulangeries / 1 000 hab.
80
Mazan 84380
0,64 boulangeries / 1 000 hab.
81
Sorgues 84700
0,63 boulangeries / 1 000 hab.
82
Monteux 84170
0,60 boulangeries / 1 000 hab.
83
Grillon 84600
0,59 boulangeries / 1 000 hab.
84
0,58 boulangeries / 1 000 hab.
85
0,57 boulangeries / 1 000 hab.
86
Le Thor 84250
0,56 boulangeries / 1 000 hab.
87
0,56 boulangeries / 1 000 hab.
88
0,47 boulangeries / 1 000 hab.
89
0,40 boulangeries / 1 000 hab.
90
0,35 boulangeries / 1 000 hab.
91
0,26 boulangeries / 1 000 hab.
92
0,22 boulangeries / 1 000 hab.

Source : OpenStreetMap — Contributeurs OSM — ODbL

FAQ — boulangeries par habitant Vaucluse

Quelle commune a le meilleur classement par boulangeries par habitant de Vaucluse ?

Puyméras arrive en tête du classement par boulangeries par habitant de Vaucluse avec 5,13 boulangeries / 1 000 hab..

Quelles sont les 3 premières communes par boulangeries par habitant de Vaucluse ?

Le podium par boulangeries par habitant de Vaucluse : 1) Puyméras, 2) Ménerbes, 3) Fontaine-De-Vaucluse.

Quelle commune est dernière par boulangeries par habitant de Vaucluse ?

Entraigues-sur-La-Sorgue est classée dernière (92e) avec 0,22 boulangeries / 1 000 hab..

Combien de communes dans ce classement par boulangeries par habitant ?

Ce classement comprend 92 communes de Vaucluse.

Existe-t-il un classement national par boulangeries par habitant ?

Oui, consultez le Top 500 national par boulangeries par habitant pour comparer les communes de toute la France.

Quelles sont les sources de données de ce classement ?

Les données proviennent des sources officielles : INSEE, DGFIP, IGN, Base Permanente des Équipements et data.gouv.fr.

Quelle est la moyenne de Vaucluse par boulangeries par habitant ?

La moyenne de Vaucluse est de 1,18 boulangeries / 1 000 hab.. La médiane se situe à 0,92 boulangeries / 1 000 hab..

Combien de communes de Vaucluse dépassent la moyenne par boulangeries par habitant ?

32 communes sur 92 ont une valeur supérieure à la moyenne départementale (1,18 boulangeries / 1 000 hab.).

Quel est l'écart entre la première et la dernière commune par boulangeries par habitant de Vaucluse ?

Puyméras affiche 5,13 boulangeries / 1 000 hab. contre 0,22 boulangeries / 1 000 hab. pour Entraigues-sur-La-Sorgue, soit un écart significatif révélateur des disparités territoriales.